Texas Education Agency
Texas Gateway: Appendices: The Use of Mathematics in Principles of Economics
This appendix should be consulted after first reading "Welcome to Economics." Though economics is not math, there is no important concept in this course that cannot be explained without mathematics. That said, math is a tool that can be...
Rice University
Rice University: Cynthia Lanius: Mathematics of Cartography
Can there be a connection between map making and math? Explore the mathematics of cartography in this resource that integrates web-based instruction, mathematical problem solving, geometry, history, and art. Interesting information and...
Annenberg Foundation
Annenberg Learner: Mathematics Illuminated: Combinatorics Counts
Video presentation on combinatorics, or the "mathematics of counting complicated configurations." Offers several examples of combinatorics as used in real world situations and professions. [28:26]
Annenberg Foundation
Annenberg Learner: Mathematics Illuminated: Topology's Twists and Turns
What is topology? And how does this area of mathematics allow us to study the shape and interconnectedness of the universe we live in? Video presentation answers these questions via a lively presentation of discussion, examples, and...
Other
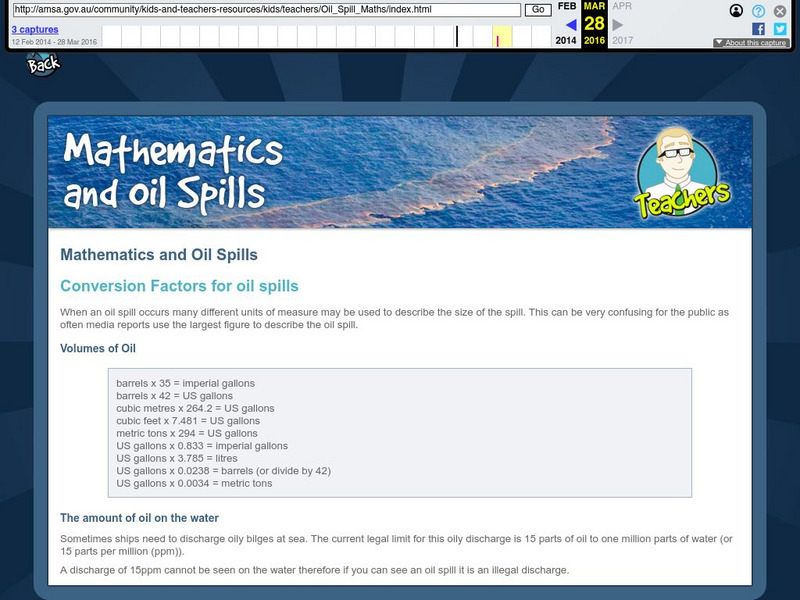
Australian Maritime Safety Authority: Mathematics and Oil Spills
The numbers related to an oil spill that are reported in the media can be quite confusing to the public. This lesson helps students understand the numerical terms used to describe an oil spill. They are asked to solve three problems...
Other
Katm: High School Common Core Standards for Mathematics Flip Book [Pdf]
A flip book that serves as a reference for teachers of Common Core Math Standards for secondary students.
McGraw Hill
Glencoe Mathematics: Online Study Tools: Integers
The online assessment demonstrates knowledge of advanced mathematical concepts in Algebra. The multiple choice questions test students on integers. Topics include performing operations with integers and graphing.
Science Buddies
Science Buddies: The Birthday Paradox
This project shows how mathematical probability sometimes contradicts our intuition. Despite the fact that there are 365 days in a year, if you survey a random group of just 23 people there is a 50:50 chance that two of them will have...
Science Buddies
Science Buddies: Divide and Conquer: Proving Pick's Theorem for Lattice Polygons
If you like to play Tetris then you might like this project. You'll learn something interesting about the mathematics of complex shapes.
Science Buddies
Science Buddies: Exploring Fractals
Although fractal images can be intriguingly complex, fractals are more than just pretty pictures. In this project, you'll explore the mathematical properties of the famous Mandelbrot and Julia sets. You'll learn about how these images...
Illustrative Mathematics
Illustrative Mathematics: F Le Do Two Points Determine an Exponential Function?
In this task, students investigate whether exponential functions will always be determined by two points. It complements the task "Do two points always determine a linear function?" Aligns with F-LE.A.2.
Illustrative Mathematics
Illustrative Mathematics: F Le.4 Graphene
This task provides a real-world context for examining the power of exponential growth and decay. Students experiment, at the macro level, using scotch tape to pull a chip of graphite apart into two pieces. They are asked to find about...
Illustrative Mathematics
Illustrative Mathematics: F Le a Valuable Quarter
The context of this task is that a quarter was put into a bank account in 1901 and students are asked to calculate its value in 2013 at two different interest rates. Those amounts are compared to the appreciation rate of a rare and...
Illustrative Mathematics
Illustrative Mathematics: F Le Basketball Bounces, Assessment Variation 1
This task asks students to analyze a set of data about the height of a basketball for each time it bounces. They choose a model that reasonably fits the data and use the model to answer questions about the physical context. This variant...
Illustrative Mathematics
Illustrative Mathematics: F Le Basketball Bounces, Assessment Variation 2
This task asks students to analyze a set of data about the height of a basketball for each time it bounces. They choose a model that reasonably fits the data and use the model to answer questions about the physical context. This second...
Illustrative Mathematics
Illustrative Mathematics: F Le Carbon 14 Dating in Practice Ii
This problem introduces Carbon 14 dating which is used by scientists to date certain organic material. This version is based on the ratio of Carbon 14 to Carbon 12, which decreases at a constant exponential rate after an organism dies....
Illustrative Mathematics
Illustrative Mathematics: F Le in the Billions and Exponential Modeling
For this task, students examine world population data from 1804 to 2012 and investigate whether an exponential function is appropriate for modeling the relationship between the world population and the year. Aligns with F-LE.A.1.c.
Illustrative Mathematics
Illustrative Mathematics: F Le Carbon 14 Dating, Variation 2
In this task on exponential decay, students calculate what the amount of Carbon 14 left in a preserved plant will be as time passes and when one microgram will be all that is left. Aligns with F-LE.A.1.c.
Illustrative Mathematics
Illustrative Mathematics: F Le Newton's Law of Cooling
For this problem, students use an exponential equation to investigate the cooling of a cup of coffee and how long it would take for it to cool down to different temperatures. Aligns with F-LE.B.5 and F-LE.A.4.
Illustrative Mathematics
Illustrative Mathematics: F Le Carbon 14 Dating in Practice I
In this task, students learn about exponential decay by examining the amount of Carbon-14 left in a preserved plant with the passage of time after the plant has died. This provides a simple introduction to Carbon-14 dating but the actual...
Illustrative Mathematics
Illustrative Mathematics: F Le, a Rei Population and Food Supply
In this task, students analyze the sizes of a country's population and of its food supply to determine when and if food shortages will occur. To solve it, they must construct and compare linear and exponential functions and find where...
Illustrative Mathematics
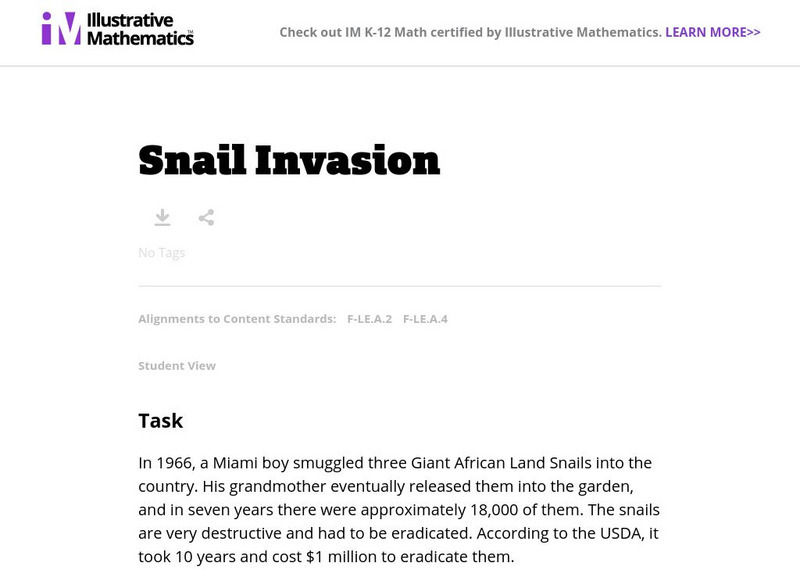
Illustrative Mathematics: F Le Snail Invasion
For this task, students investigate the power of exponential growth in this real-world example of an invasive species that was introduced to Florida in 1966, a giant snail. Aligns with F-LE.A.2 and F-LE.A.4.
Illustrative Mathematics
Illustrative Mathematics: F Le Illegal Fish
In this task, students learn about exponential functions when they investigate the exponential growth of an invasive fish population. Aligns with F-LE.B.5 and F-LE.A.1.c.
Illustrative Mathematics
Illustrative Mathematics: F Le Us Population 1790 1860
In this task, students are shown a table of U.S. population data between 1790 and 1860 and are asked to explore whether exponential functions would be appropriate to model relationships within the data. The purpose of the task is to help...



![Katm: High School Common Core Standards for Mathematics Flip Book [Pdf] Handout Katm: High School Common Core Standards for Mathematics Flip Book [Pdf] Handout](https://static.lp.lexp.cloud/images/attachment_defaults/resource/large/FPO-knovation.png)


