Curated OER
Linear Functions
Your learners will explore linear functions by analyzing a graph of the linear equations.Then learners analyze through calculating f(x+P) and g(x+p)
Curated OER
In the Billions and Linear Modeling
Your learners analyze population data to discern if it best fits a linear scenario. The idea of change by equal differences over equal intervals is enforced in this real-life task.
Texas Instruments
Texas Instruments: Balloon
Students inflate a balloon and observe the relationship between the rate its volume is changing and the rate points on its surface are getting closer to each other. They use the their calculator to determine the exact rate of change.
Illustrative Mathematics
Illustrative Mathematics: F Le Linear or Exponential?
In this task, students are asked to identify whether changes are linear or exponential. Aligns with F-LE.A.1.
Khan Academy
Khan Academy: Algebra I: Exponential vs. Linear Growth Over Time
Practice analyzing the end behavior of two functions that model similar real-world relationships, where one function is exponential and the other is polynomial. Students receive immediate feedback and have the opportunity to try...
Khan Academy
Khan Academy: Algebra I: Exponential vs. Linear Models
Given a description of a real-world relationship, determine whether that relationship is linear or exponential. Students receive immediate feedback and have the opportunity to try questions repeatedly, watch a video or receive hints.
Khan Academy
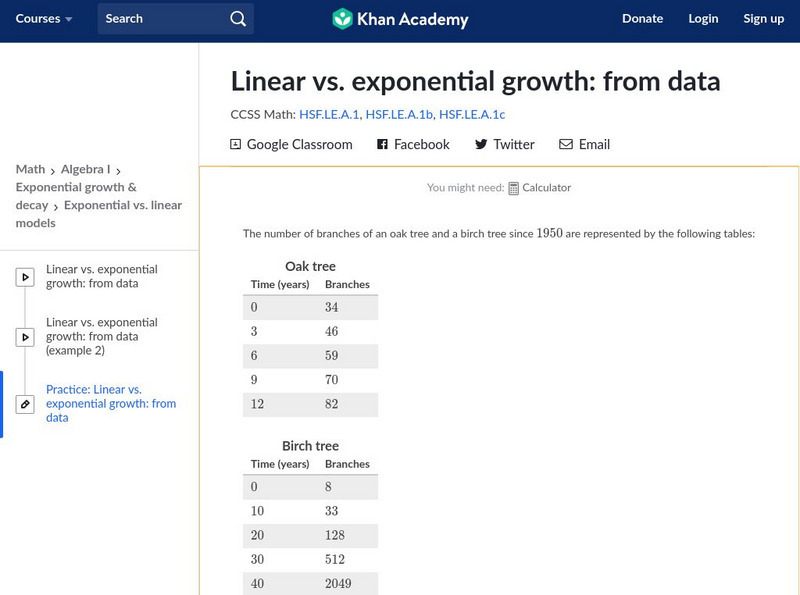
Khan Academy: Algebra I: Linear vs. Exponential Growth: From Data
Given a table with values of two quantities over time, determine whether the quantities grow linearly or exponentially. Students receive immediate feedback and have the opportunity to try questions repeatedly, watch a video or receive...
Khan Academy
Khan Academy: Average Rate of Change: Graphs and Tables
Find a function's average rate of change over a specific interval, given the function's graph or a table of values. Students receive immediate feedback and have the opportunity to try questions repeatedly or receive hints.
Khan Academy
Khan Academy: Average Rate of Change Word Problems
Find and represent the average rate of change of a real-world relationship. Students receive immediate feedback and have the opportunity to try questions repeatedly or receive hints.
Khan Academy
Khan Academy: Average Rate of Change
Find the average rate of change of a function over a given interval. Students receive immediate feedback and have the opportunity to try questions repeatedly, watch a video or receive hints.
Math Graphs
Houghton Mifflin: Math Graphs: Estimating Slope 10 [Pdf]
Learners determine how much one variable changes in relation to the change of another variable. The math graph is available in PDF format.
Math Graphs
Houghton Mifflin: Math Graphs: Estimating Slope 11 [Pdf]
Learners determine how much one variable changes in relation to the change of another variable. The math graph is available in PDF format.
Sophia Learning
Sophia: Finding Rates of Change in Linear Relationships: Lesson 3
This lesson demonstrates how to find the rate of change in functions with linear relationships. It is 3 of 5 in the series titled "Finding Rates of Change in Linear Relationships."


![Houghton Mifflin: Math Graphs: Estimating Slope 10 [Pdf] Unknown Type Houghton Mifflin: Math Graphs: Estimating Slope 10 [Pdf] Unknown Type](https://static.lp.lexp.cloud/images/attachment_defaults/resource/large/FPO-knovation.png)
