University of California
Student Workbook: Statistics and Probability
Statistically, practicing this packet completely helps young mathematicians do well on the test. The packet is adaptable to many grade levels as it includes basic probability and goes up to data analysis with mean, median, and...
Curated OER
Lesson: Guilt-Free Chocolate
Experiment with chocolate coating on cookies! What a delightful way to learn about food processing and chemical engineering. Throughout this activity, groups collect measurements and make calculations. They conclude by writing...
Shodor Education Foundation
Stem and Leaf Plotter
The key is in the leaves. Pupils enter data to create a stem-and-leaf plot. The resource then displays the plot and calculates the mean, median, and mode of the data. Using the plot and the calculated measures of spread, learners analyze...
Shodor Education Foundation
Skew Distribution
Slide the class into a skewed view. Learners alter the location of the median relative to the mean of a normal curve to create a skew distribution. They compare the curve to a histogram distribution with the same skewness.
Shodor Education Foundation
Plop It!
Build upon and stack up data to get the complete picture. Using the applet, pupils build bar graphs. As the bar graph builds, the interactive graphically displays the mean, median, and mode. Learners finish by exploring the changes in...
Shodor Education Foundation
Measures
Take a look at data from a statistical lens. An interactive allows pupils to enter data set, labeling the data including the units used. Manipulating the applet, learners select the statistics to calculate that include total, mean,...
Shodor Education Foundation
Box Plot
What information can come from a box? Learners choose a data set to display as a box plot and decide whether to include the median in the calculation of the quartiles, show the outliers, and change the scale. To finish the lesson,...
Shodor Education Foundation
Overlapping Gaussians
Adjust the overlap to compare probabilities. Using sliders, learners adjust the shape of two Gaussian curves. The interactive calculates the area of the left tail for one curve and the right tail for the other. Pupils set the interactive...
Education Development Center
Interpreting Statistical Measures—Class Scores
Explore the effect of outliers through an analysis of mean, median, and standard deviation. Your classes examine and compare these measures for two groups. They must make sense of a group that has a higher mean but lower median compared...
Curated OER
Pi Day: The Other Math Holiday!
Happy Pi Day! This collection of games, experiments, and activities leads participants through an exploration of the many aspects and attributes of that mysterious quantity, pi. Activities range from using statistical...
Curated OER
Flipping for a Grade
What happens when your teachers get tired of grading tests and want to use games of chance to determine your grade? How would you decide which game they should play? Learn how to use expected value and standard notation to compare two...
Illustrative Mathematics
Accuracy of Carbon 14 Dating I
Here is an activity that is intended to highlight a very important issue about precision in reporting and understanding statements in a realistic scientific context. Discuss different ways of reporting the half life of Carbon 14...
CK-12 Foundation
Ck 12: Statistics: Standard Deviation of a Normal Distribution
[Free Registration/Login may be required to access all resource tools.] Learn about the spread of a normal distribution.
Palomar Community College District
Palomar College: Behavioral Science Statistics: Variance and Standard Deviation
A series of step-by-step worked problems demonstrating how to take a set of data and produce the variance and standard. Hints are provided along the way and the final measures are shown for the user to check.
CK-12 Foundation
Ck 12: Algebra Ii: 5.4 Standard Deviation
Explore what the standard deviation is as it relates to the graph of a normal distribution curve.
Other
James Wright: Measures of Central Tendency
This site looks at measures of central tendency and dispersion. Discussed are topics such as standard deviation, mean, median, and mode.
Stefan Warner and Steven R. Costenoble
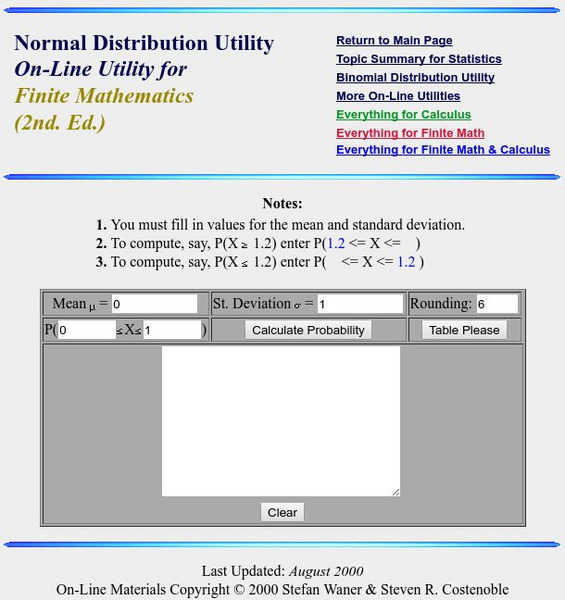
Finite Mathematics & Applied Calculus: Normal Distribution Utility
The learning tool calculates the probability of a normal distribution.
Stefan Warner and Steven R. Costenoble
Finite Mathematics & Applied Calculus: Normal Distribution Table
The resource consists of a normal distribution table.
BBC
Bbc: Standard Deviation
A demonstration of how to find the standard deviation of a set of data. Several examples and a practice test are offered.


