Curated OER
Lesson: Guilt-Free Chocolate
Experiment with chocolate coating on cookies! What a delightful way to learn about food processing and chemical engineering. Throughout this activity, groups collect measurements and make calculations. They conclude by writing...
Shodor Education Foundation
Skew Distribution
Slide the class into a skewed view. Learners alter the location of the median relative to the mean of a normal curve to create a skew distribution. They compare the curve to a histogram distribution with the same skewness.
Shodor Education Foundation
Measures
Take a look at data from a statistical lens. An interactive allows pupils to enter data set, labeling the data including the units used. Manipulating the applet, learners select the statistics to calculate that include total, mean,...
Shodor Education Foundation
Normal Distribution
Does the size of the bin matter? The resource allows pupils to explore the relationship between the normal curve and histograms. Learners view histograms compared to a normal curve with a set standard deviation. Using the interactive,...
Shodor Education Foundation
Overlapping Gaussians
Adjust the overlap to compare probabilities. Using sliders, learners adjust the shape of two Gaussian curves. The interactive calculates the area of the left tail for one curve and the right tail for the other. Pupils set the interactive...
Illustrative Mathematics
Accuracy of Carbon 14 Dating I
Here is an activity that is intended to highlight a very important issue about precision in reporting and understanding statements in a realistic scientific context. Discuss different ways of reporting the half life of Carbon 14...
CK-12 Foundation
Ck 12: Statistics: Standard Deviation of a Normal Distribution
[Free Registration/Login may be required to access all resource tools.] Learn about the spread of a normal distribution.
Palomar Community College District
Palomar College: Behavioral Science Statistics: Variance and Standard Deviation
A series of step-by-step worked problems demonstrating how to take a set of data and produce the variance and standard. Hints are provided along the way and the final measures are shown for the user to check.
CK-12 Foundation
Ck 12: Algebra Ii: 5.4 Standard Deviation
Explore what the standard deviation is as it relates to the graph of a normal distribution curve.
CK-12 Foundation
Ck 12: Algebra Ii: 5.3 Normal Distribution
This section explores normal distribution curves that have a unique, bell-like shape and represent data that is "normally" distributed. It also addresses how many real-life situations can be modeled by normal distribution curves.
Stefan Warner and Steven R. Costenoble
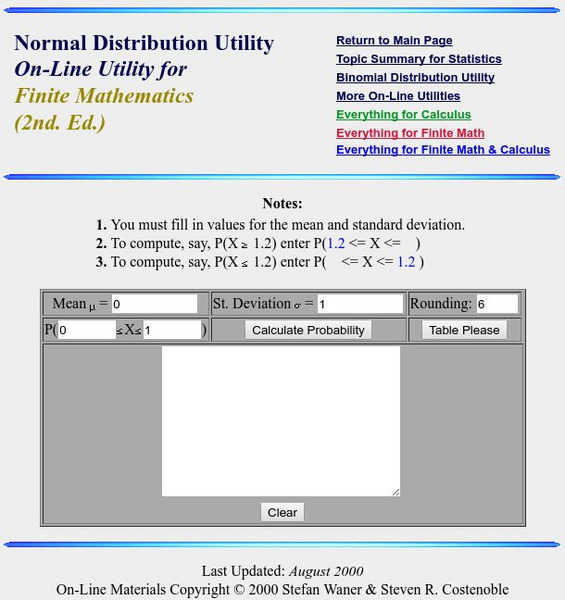
Finite Mathematics & Applied Calculus: Normal Distribution Utility
The learning tool calculates the probability of a normal distribution.
Stefan Warner and Steven R. Costenoble
Finite Mathematics & Applied Calculus: Normal Distribution Table
The resource consists of a normal distribution table.
BBC
Bbc: Standard Deviation
A demonstration of how to find the standard deviation of a set of data. Several examples and a practice test are offered.


