Shodor Education Foundation
Spinner
Go round and round to compare theoretical and experimental probabilities. Learners set the number of sectors and the number of spins for a spinner. Then, a table displays the experimental and theoretical probabilities of the spinner for...
Shodor Education Foundation
Two Colors Applet
Find the box with two green balls. The applet uses six balls, three green and three red, and hides them in three boxes. Pupils choose a box and click on it to reveal the color of balls inside. Using the chosen box, the simulation keeps...
Shodor Education Foundation
Marbles
Grab some marbles from a bag. The applet simulates drawing marbles from a bag. Pupils determine the number of four colors of marbles in a bag and how many marbles to draw. Using information on whether order matters in the draw and if...
Shodor Education Foundation
Crazy Choices Game
Wanna take a chance on which game is best? The resource provides three games of chance using multiple types of games. Games range from coin toss to cards. Choosing a type of game, pupils determine what wins and enter the theoretical...
Shodor Education Foundation
Racing Game with One Die
Pupils roll a die to figure out which car advances on a race track. They determine the rules for each car moving forward and, given the statistics of the winner, compare if it matches their predictions.
Shodor Education Foundation
Experimental Probability
Spin into a dicey experiment. Pupils use a spinner or a pair of dice to determine the experimental probabilities of each outcome. The interactive allows for either, one, five, or ten consecutive experiments. Using the applet, learners...
Diablo Valley College
The Language of Sets and Set Notation
The basics of number theory and set notation are explained in a highly approachable way in a self-contained lesson plan and worksheet. Introducing the vocabulary and concepts from ground zero and building to more complex ideas of...
Texas Instruments
Texas Instruments: Sampling Distributions
Students study the distribution of sample proportions with a simulation. They find a small sample size leads to skewed distribution and as the sample size increases, the distribution becomes more normal.
Annenberg Foundation
Annenberg Learner: Against All Odds: Random Variables
Video presentation on the probability of independent events, covering related topics: multiplication rule, random variable, and mean and standard deviation. [28:41]
CK-12 Foundation
Ck 12: Statistics: Density Curve of the Normal Distribution
[Free Registration/Login may be required to access all resource tools.] This Concept expands upon the previous by discussing further the normal distribution and the probabilities associated with it by looking at the normal density curve.
Stefan Warner and Steven R. Costenoble
Finite Mathematics & Applied Calculus: Histogram and Probability Distribution Generator
The learning tool displays data in the form of a histogram. The tool also shows descriptive statistics and probability distributions. Examples of data are included.
Stefan Warner and Steven R. Costenoble
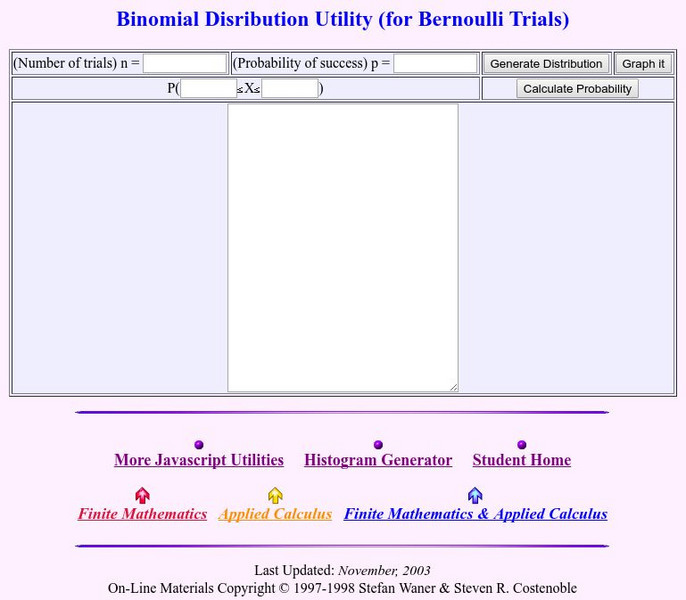
Finite Mathematics & Applied Calculus: Binomial Distribution Utility
The learning tool calculates the probability of a binomial distribution.
Stefan Warner and Steven R. Costenoble
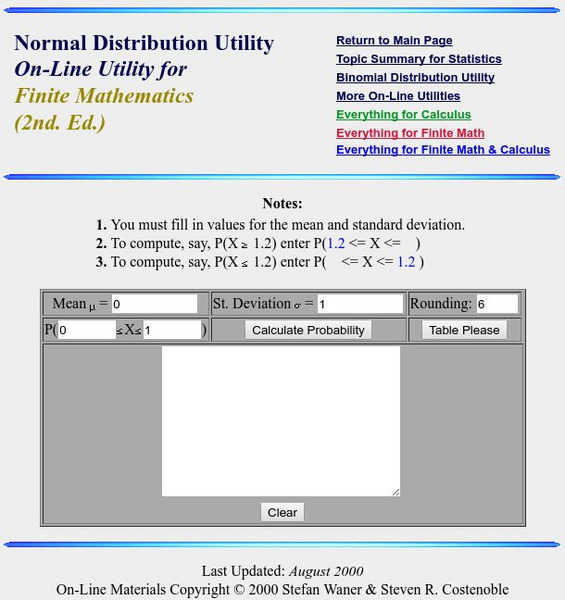
Finite Mathematics & Applied Calculus: Normal Distribution Utility
The learning tool calculates the probability of a normal distribution.
Stefan Warner and Steven R. Costenoble
Finite Mathematics & Applied Calculus: Normal Distribution Table
The resource consists of a normal distribution table.


