Annenberg Foundation
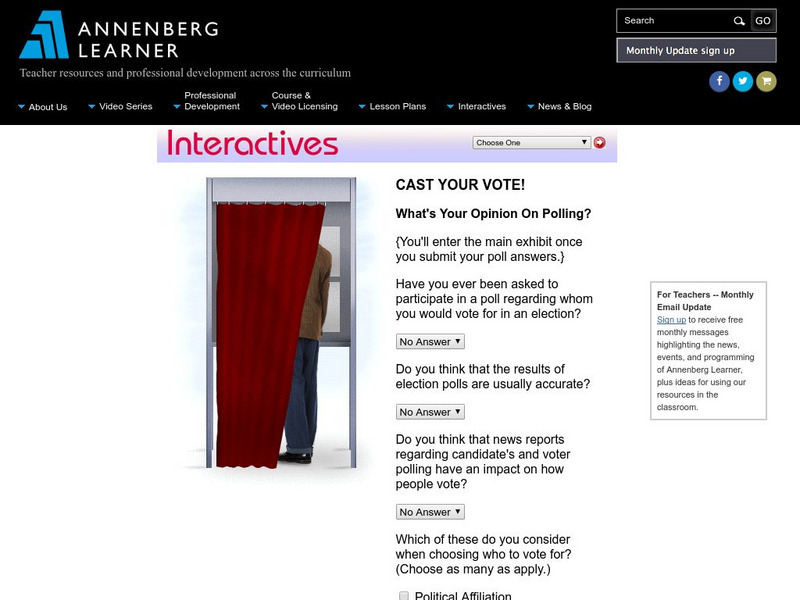
Annenberg Learner: Interactives: Cast Your Vote!
Upper elementary, middle, and high school students can use this exhibit to get an understanding of how polls and elections are conducted. The discussion includes random samples, margins of error, and other concepts related to statistics.
Center for Innovation in Engineering and Science Education, Stevens Institute of Technology
Ciese: Down the Drain Project
Teachers can start this project at any time and no registration is required. Students collect data about water usage for themselves, their homes and their class. They analyze it, make predictions about it, and submit the data to the...
Center for Innovation in Engineering and Science Education, Stevens Institute of Technology
Ciese: Population Growth Project
In this collection of nine lessons, students use data from the U.S. Census to create population growth models and to examine the impact of changes in population factors such as age, demographic, etc.
Center for Innovation in Engineering and Science Education, Stevens Institute of Technology
Ciese Navigational Vectors
For this project, students use real time data to learn how pilots navigate when they fly. Students go through a series of lessons on vectors, weather maps and flight tracking, then take a pilot's test where they apply what they have...
BSCS Science Learning
Bscs: Globe at Night Dark Skies
In this inquiry, students predict the best place to stargaze in Arizona based on the brightness of the night sky. Students are introduced to the concept of light pollution and Globe at Night, a global citizen science project in which...
BSCS Science Learning
Bscs: Global Night Sky Comparison
This inquiry invites students to investigate human impacts on the environment. Specifically, students will examine the relationship between human population, light pollution, and how brightly celestial objects like stars appear in the...
BSCS Science Learning
Bscs: Budburst Lilac Festival
In this Inquiry, students predict the best date to host a lilac blossom festival so that lilacs are in full bloom in the city where students live. Students are introduced to Project Budburst, a citizen science project in which volunteers...
BSCS Science Learning
Bscs: Globe at Night Dark Skies
In this inquiry, young scholars predict the best place to stargaze in Arizona based on the brightness of the night sky. Students are introduced to the concept of light pollution and Globe at Night, a global citizen science project in...
Texas Instruments
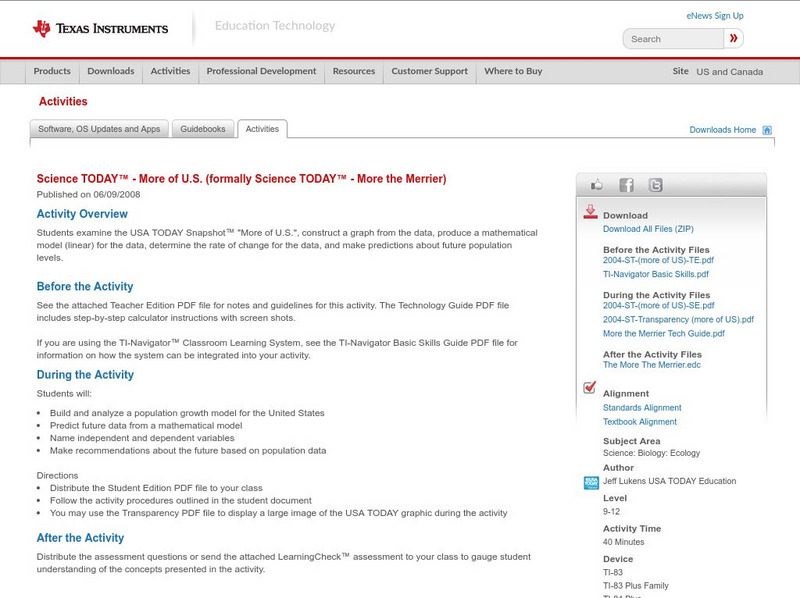
Texas Instruments: Science Today More of u.s.
Students examine the USA TODAY Snapshot "More of U.S.", construct a graph from the data, produce a mathematical model (linear) for the data, determine the rate of change for the data, and make predictions about future population levels.
Texas Instruments
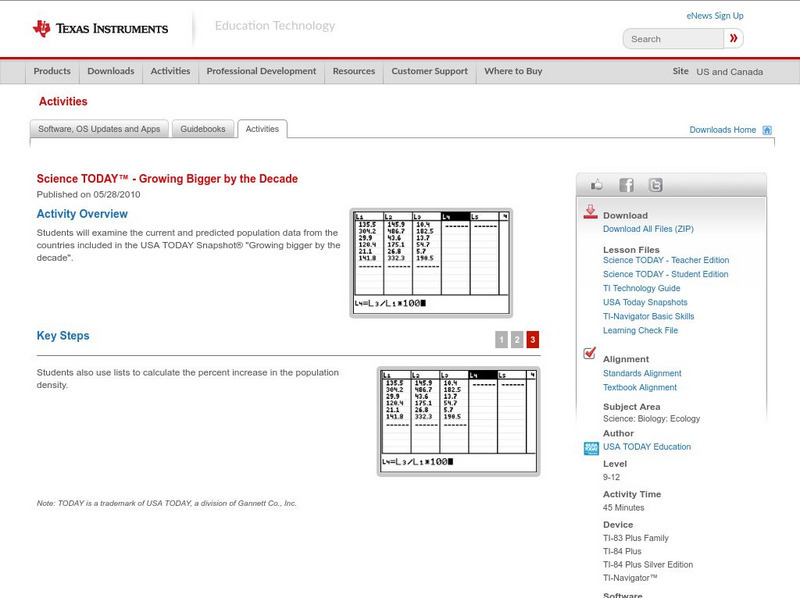
Texas Instruments: Science Today Growing Bigger by the Decade
Students will examine the current and predicted population data from the countries included in the USA TODAY Snapshot "Growing bigger by the decade".
Texas Instruments
Texas Instruments: Forensics Case 9: Killer Cup of Coffee: Using Colorimetry
In this activity, Students can use colorimetry to determine the concentration of a colored species in a solution and use a linear relationship to model Beer's law. They use Beer's law to determine the concentration of...
Texas Instruments
Texas Instruments: Easy Data App
This App brings a new level of simplicity to calculator-based data collection, making data collection simple and fast.
Microsoft
Microsoft Education Lesson Plan: Making Money From Lemons
Simulation where learners apply mathematics and economics concepts in the lemonade business. Learners set up a virtual lemonade stand and must determine production costs, product variables, and profits. Students record data collected on...
National Council of Teachers of Mathematics
Nctm: Illuminations: Histogram Tool
This tool can be used to create a histogram for analyzing the distribution of a data set using data that you enter or using pre-loaded data that you select.
McGraw Hill
Glencoe: Interpreting Data Quiz
This is a quiz with five quick questions to check your understanding of how to interpret data. It is self checking.


