Curated OER
M&M Statistics
Pupils determine the difference between guessing and making a prediction. They discuss what they could graph using a bag of M&M's. They take a Raw data sample and convert it into a sample. They graph the actual results and combine...
Curated OER
Who Built It?
Seventh graders study the difference between architectural detail from the Romanesque and Gothic eras. The class participates in discussion on are in different eras. They predict what picture belongs in what era.
Curated OER
Observing Fall Migrants
Students keep a detailed data collection log of the different types of monarch behavior. They track the weather conditions daily and link it to the migration of the monarchs. They summarize their data using either a graph or a computer...
Curated OER
Genetics Lesson
Students investigate the genetic nature of skeletons while collecting data from an Internet site. They read a case study on the Internet and complete the associated activity.
Curated OER
Let It Rain
Students study the effects of water erosion on soil by gathering and analyzing data during an experiment. They decide on appropriate units of measurement to apply in problem solving.
Curated OER
Making Your Own Sampling Tools
Students begin a class recycling project. They create data sampling equipment using their own designs and test them in the field.
Curated OER
Parts Are Parts: The English Measurement System
Third graders view and measure common body parts to find a fathom, a span, and inch. They discuss the historical information about how standard English measurements came to be and why body parts can no longer be used as a standard...
Curated OER
Follow Spring's Journey North Recording Highlights of the Season
Students scan headlines on the Journey North News Updates each day to track the changes that spring brings as it comes to different areas of the United States.
Curated OER
Raisin Cane
Students estimate and record the number of raisins in a snack-size box. They also graph their results and note the differences (+ or -) from their estimate and actual number.
Curated OER
Viewing Tubes
Students complete a lab in order to discover if the length of a viewing tube, its diameter, or the distance from an object affect the type of data collected and the resulting graph.
Curated OER
Bubbles
Third graders perform an experiment using different mixtures of dishwasher detergent. They construct bar graphs that record their bubble data for each detergent set.
Annenberg Foundation
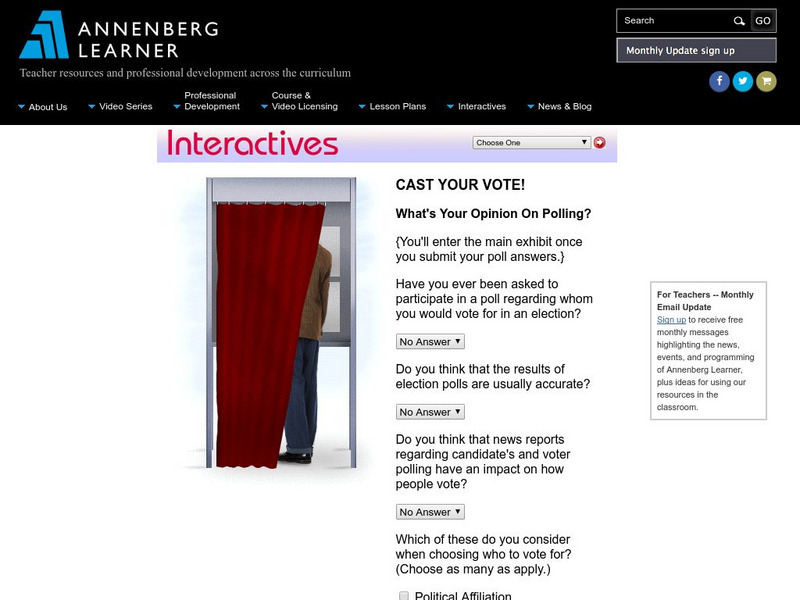
Annenberg Learner: Interactives: Cast Your Vote!
Upper elementary, middle, and high school students can use this exhibit to get an understanding of how polls and elections are conducted. The discussion includes random samples, margins of error, and other concepts related to statistics.
Center for Innovation in Engineering and Science Education, Stevens Institute of Technology
Ciese: Down the Drain Project
Teachers can start this project at any time and no registration is required. Students collect data about water usage for themselves, their homes and their class. They analyze it, make predictions about it, and submit the data to the...
BSCS Science Learning
Bscs: Global Night Sky Comparison
This inquiry invites students to investigate human impacts on the environment. Specifically, students will examine the relationship between human population, light pollution, and how brightly celestial objects like stars appear in the...
Texas Instruments
Texas Instruments: Easy Data App
This App brings a new level of simplicity to calculator-based data collection, making data collection simple and fast.
Texas Instruments
Texas Instruments: Step by Step Activity Data Collection & Analysis
In this activity, students create a situation that produces linear behavior by stepping heel to toe and taking distance readings as each step is taken. Students then apply the properties of a linear function to develop a model for motion.
Microsoft
Microsoft Education Lesson Plan: Making Money From Lemons
Simulation where learners apply mathematics and economics concepts in the lemonade business. Learners set up a virtual lemonade stand and must determine production costs, product variables, and profits. Students record data collected on...
Alabama Learning Exchange
Alex: Pass It Down
This lesson, Pass It Down, integrates science and math into two consecutive hands-on genetics activities that should be embedded within an existing genetics unit suitable for biology students. The results of each activity will be...
Alabama Learning Exchange
Alex: Lip Balm Science
During this lesson, students will make three types of lip balm. They will then predict which lip balm they think will be preferred by testers and test that prediction by collecting data from testers who sample the lip balms. They will...
Concord Consortium
Concord Consortium: California American Community Survey (Acs) Data Portal
Working with large datasets that support exploration of patterns is an essential first step in becoming fluent with data. In this dynamic data science activity, students can access part of the U.S. Census Bureau's American Community...
Concord Consortium
Concord Consortium: National Health and Nutrition Examination Survey Data Portal
Access and explore large datasets from the National Health and Nutrition Examination Survey (NHANES, 2003). Working with large datasets that emphasize exploration, finding patterns, and modeling is an essential first step in becoming...
Sophia Learning
Sophia: Handling Laboratory Samples: Lesson 2
This lesson will explain the techniques and glassware used to "deliver" samples versus measure and "contain" samples. It is 2 of 3 in the series titled "Handling Laboratory Samples."
McGraw Hill
Glencoe: Interpreting Data Quiz
This is a quiz with five quick questions to check your understanding of how to interpret data. It is self checking.


