Curated OER
Pictograph Cave
Fourth graders investigate the concept of using pictographs as rock art. They examine the discoveries of art made within caves in order to comprehend the culture that painted them. Students write creative stories about the images and...
Curated OER
Tracking the Storm
Students discuss the different types of storms that can hit land. They locate specific coordinates on a plane grid. They discuss lonsgitude and latitude to plot the coordinates of a tropical storm. They practice finding coordinates...
Curated OER
Spreadsheet Graphs
Students create graphs using information from spreadsheets. They select a topic from the following choices: website use, digital cameras, spreadsheets, calculators or educational software. They tally the class results and create an...
Curated OER
Twelve Days of Christmas
Pupils create charts and graphs using a spreadsheet. They chart the number of each gift given day by day from the song, "The Twelve Days of Christmas." They create a bar graph and a circle graph from their data on the spreadsheet.
Curated OER
Statistical Accuracy and Reliability
Ninth graders assess the accuracy and reliability of current survey data and how it is represented. They design a survey, collect data, and use technology to analyze the data and present the results. Students examine scatter plots and...
Curated OER
Timed Multiplication Test Graphs
Young scholars use the tools of data analysis for managing information. They solve problems by generating, collecting, organizing, displaying histograms on bar graphs, circle graphs, line graphs, pictographs and charts. Students...
Curated OER
Creating Bar Graph
Seventh graders, after an explanation and demonstration compare how many different places there at Cocowalk.
Curated OER
Charting Weight
Sixth graders record the weight of themselves and 3 family over a week, and then use that data to compile 2 bar graphs and 4 line graphs and answer a series of questions.
Curated OER
Record 'The' Results
Third graders predict how many times they'll see the word "the" in a newspaper page and highlight all the "the"s they find. After reviewing definitions of range, median, mode, mean they create a Stem and Leaf Plot and a Back-to-Back Stem...
Curated OER
The Tale of Scale
Eighth graders, using a range of data, produce three bar graphs for various scales along the y-axis.
Curated OER
Pictograph to Bar Graph
Second graders explore organizing data to make it useful for interpreting picture graphs and bar graphs. They use Graphers software to create a pictograph and a bar graph.
Curated OER
Graph It!
First graders use organized data to construct real object graphs, picture graphs, and bar-type graphs.
Curated OER
Usage and Interpretation of Graphs
Young scholars review graphing and use processing skills to solve problems.
Curated OER
The Die Is Cast
Second graders use tally marks to tabulate and count the number of times each number on a die is rolled.
Curated OER
Apples Galore! (Elementary, Language)
Fifth graders examine and taste 7-8 difference apples, describe the flavor/texture, then graph the results of favorites. Finally students write a paragraph describing their favorite.
William Mueller
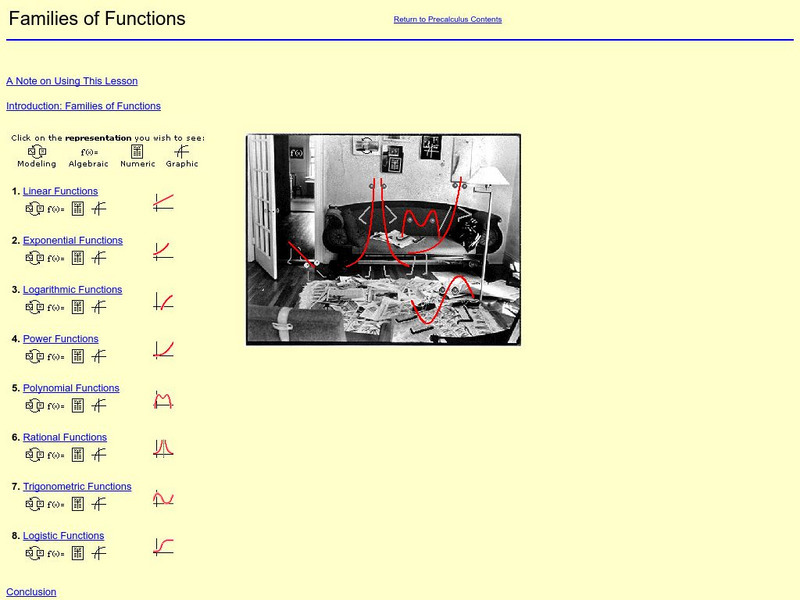
William Mueller: Families of Functions
Meet the Function Family! Each member of the family has examples of their graphs and descriptions of the types of real-world situation that produce those graphs.
That Quiz
That Quiz: Practice Test: Graphs
This resource allows users to test their knowledge of graphs and graphing methods.
Texas Instruments
Texas Instruments: Active Wear Adventure 10
In this adventure, students test which solar collector--black, white, or silver-- absorbs the most heat. They compare the difference between absorption and reflection. They create, interpret and analyze graphs of data. They also relate...
Texas Instruments
Texas Instruments: Buried Objects Adventure 1
Students use the CBR 2 to gather data and identify "buried" objects. They interpret and analyze graphs of height as a function of time, and use the change in the y-coordinates of an ordered pair to determine the height of an object.
Math Is Fun
Math Is Fun: Linear Equation Test
This interactive site checks students' understanding of slope and intercept. Seven question require students to determine slope and intercept of a line from the graph. The site is a test that can be scored on-line.
CK-12 Foundation
Ck 12: Algebra: Graphs of Linear Equations
[Free Registration/Login may be required to access all resource tools.] Students learn to write and graph linear equations to represent a function and analyze graphs of linear functions. Students examine guided notes, review guided...
CK-12 Foundation
Ck 12: Algebra: Graphs Using Slope Intercept Form
[Free Registration/Login may be required to access all resource tools.] Identify the slope and y-intercept of lines and graph linear equations that are in slope-intercept form.
CK-12 Foundation
Ck 12: Algebra: Problem Solving With Linear Graphs
[Free Registration/Login may be required to access all resource tools.] Devise a problem-solving strategy that uses a graph to solve real-world problems.
CK-12 Foundation
Ck 12: Algebra: Compound Inequalities
[Free Registration/Login may be required to access all resource tools.] Write, solve, and graph on a number line compound inequalities.


