Curated OER
Ocean Temperatures
Students list data collected by marine buoys and the different kinds of moored buoys. They describe how data is transmitted worldwide. They explain the difference between near shore and offshore air and water temperatures.
Annenberg Foundation
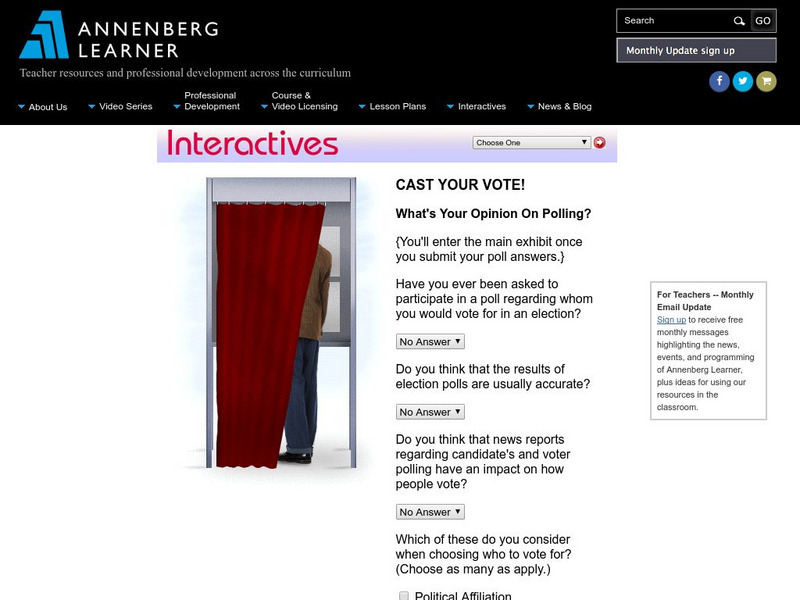
Annenberg Learner: Interactives: Cast Your Vote!
Upper elementary, middle, and high school students can use this exhibit to get an understanding of how polls and elections are conducted. The discussion includes random samples, margins of error, and other concepts related to statistics.
Microsoft
Microsoft Education Lesson Plan: Candy Is Dandy
Explore color distribution of M&M candies using this detailed lesson plan. An engaging integrated lesson that requires understanding of spreadsheets and formulas, and logical reasoning. Links to related websites.
University of Cambridge
University of Cambridge: Maths and Sports: Olympic Records
Can you work out which Olympics athletics event each anonymised graph of Olympic records data represents? This activity, aimed at Key Stage 3 (age 11-14), gives students the opportunity to make sense of graphical data and challenges them...
McGraw Hill
Glencoe: Interpreting Data Quiz
This is a quiz with five quick questions to check your understanding of how to interpret data. It is self checking.


