Curated OER
Virginia In the World: The Geography of Commerce
Students examine how Virginia connects with the world through export trade. Using a map, they use symbols to depict the value of trade and the direction of the flow of goods. They complete a scavenger hunt using electronic almanacs and...
Curated OER
Mechanical Energy
Middle schoolers discover the difference between kinetic and potential energy in an experiment using toy cars and tracks. In small groups, they set up the experiment to determine the distance milk cartons will travel when hit by toy car....
Curated OER
Who Am I? Famous Scientists
In this scientists worksheet, students read a brief synopsis of a scientist, then try to identify the person, 12 total. Worksheet contains links to additional activities.
Texas Education Agency
Texas Gateway: Analyze Graphical Sources: Practice 2 (English I Reading)
Analyze the factual, quantitative, and technical data in graphs and charts.
National Council of Teachers of Mathematics
Nctm: Illuminations: Histogram Tool
This tool can be used to create a histogram for analyzing the distribution of a data set using data that you enter or using pre-loaded data that you select.
McGraw Hill
Glencoe: Interpreting Data Quiz
This is a quiz with five quick questions to check your understanding of how to interpret data. It is self checking.
BSCS Science Learning
Bscs: Frog Symphony
This inquiry focuses on analyzing spatial and temporal data for frog calls to determine the best time of day and location to hear a symphony of frogs. Click on the link for teaching guides and handouts.
American Institute of Biological Sciences
Action Bioscience: Biocomplexity: The New Bioscience Frontier
Embrace biocomplexity as a newer concept in science. Discover why it might be important to merge data from very diverse studies and analyze them.
Center for Innovation in Engineering and Science Education, Stevens Institute of Technology
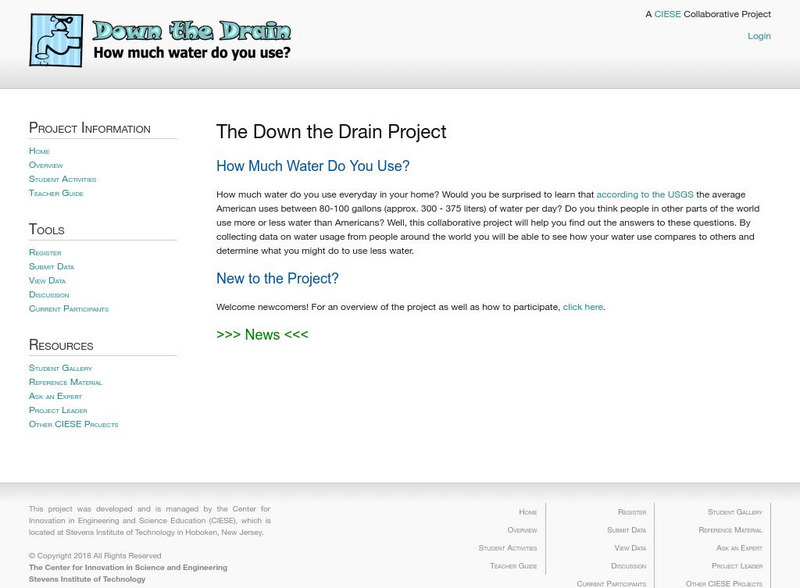
Ciese: Down the Drain Project
Teachers can start this project at any time and no registration is required. Students collect data about water usage for themselves, their homes and their class. They analyze it, make predictions about it, and submit the data to the...
Other
National Security Agency: Line Plots: Frogs in Flight [Pdf]
Students learn how to construct and interpret line plots. The lesson plan describes an activity that has students collect data, create line plots, and interpret and analyze the data.
Illustrative Mathematics
Illustrative Mathematics: F Le Basketball Bounces, Assessment Variation 1
This task asks students to analyze a set of data about the height of a basketball for each time it bounces. They choose a model that reasonably fits the data and use the model to answer questions about the physical context. This variant...
Texas Instruments
Texas Instruments: Inverse of Two Temps
In this activity, students find a conversion equation that will calculate the corresponding Celsius temperature for any given Fahrenheit temperature. Students learn to graph scatter plots, analyze and graph linear equations, compute and...
Texas Instruments
Texas Instruments: Active Wear Adventure 10
In this adventure, students test which solar collector--black, white, or silver-- absorbs the most heat. They compare the difference between absorption and reflection. They create, interpret and analyze graphs of data. They also relate...
Texas Instruments
Texas Instruments: Buried Objects Adventure 1
Students use the CBR 2 to gather data and identify "buried" objects. They interpret and analyze graphs of height as a function of time, and use the change in the y-coordinates of an ordered pair to determine the height of an object.
Alabama Learning Exchange
Alex: Lip Balm Science
During this lesson, students will make three types of lip balm. They will then predict which lip balm they think will be preferred by testers and test that prediction by collecting data from testers who sample the lip balms. They will...
TeachEngineering
Teach Engineering: A Lego Introduction to Graphing
Students use a LEGO ball shooter to demonstrate and analyze the motion of a projectile through use of a line graph. This activity involves using a method of data organization and trend observation with respect to dynamic experimentation...
Other
Simple Science: Ramps and Ratios
The interactive tutorial explores ramps and ratios. Learners view and analyze images of ramps and steps to see if they conform to the requirements of the Americans with Disabilities Act. The activity has students measure vertical and...
TeachEngineering
Teach Engineering: Determining Concentration
Students quantify the percent of light reflected from solutions containing varying concentrations of red dye using LEGO MINDSTORMS NXT bricks and light sensors. They begin by analyzing a set of standard solutions with known...
TeachEngineering
Teach Engineering: All Fat Is Not Created Equally!
Students learn that fats found in the foods we eat are not all the same; they discover that physical properties of materials are related to their chemical structures. Provided with several samples of commonly used fats with different...
Other
Great Lakes Bioenergy Research Ctr.: Exploring Energy Transformations in Plants
This set of lessons has students investigate how plants obtain energy from different sources to support their growth and development. Students conduct investigations, make predictions, and construct scientific explanations of the...
Illustrative Mathematics
Illustrative Mathematics: F Le Basketball Bounces, Assessment Variation 2
This task asks students to analyze a set of data about the height of a basketball for each time it bounces. They choose a model that reasonably fits the data and use the model to answer questions about the physical context. This second...
Texas Instruments
Texas Instruments: How High Will It Bounce?
In this activity, students collect the height versus time data of a bouncing ball using the CBR 2. They find the relationship between the bounce number and the bounce height. They learn to graph scatter plots, calculate the maximum value...
Science Education Resource Center at Carleton College
Serc: Mn Step: Study of Student Precision Using Volumetric Glassware
This activity is an exercise in using various lab equipment for measuring the volume of a liquid. Data is recorded on a spreadsheet and analyzed to see which tool offers the greatest precision.


![National Security Agency: Line Plots: Frogs in Flight [Pdf] Lesson Plan National Security Agency: Line Plots: Frogs in Flight [Pdf] Lesson Plan](https://content.lessonplanet.com/knovation/original/122495-587001a487c71ef32e76fdab66ff794e.jpg?1661494304)
