Curated OER
Understanding Latitude and Longitude
Teaching learners about latitude and longitude can get a little complicated. Present the concept by first representing it as a graph. Just like finding a location on a graph using the x and y-axis, learners will be able to locate items...
Curated OER
Creating Graphs
This graphing PowerPoint demonstrates how to use graphs to gather information. The slides contain examples of graphs and display the data clearly. This presentation also gives clear directions on how to construct various graphs by using...
Curated OER
Intersecting Graphs
Ninth graders know how to solve a system of linear equations, but what happens when the system involves an exponential function? The instructional slideshow teaches viewers to determine solutions to systems of equations with linear...
Curated OER
Domain and Range
Relations, and functions, and line tests, oh my! An instructional slideshow demonstrates the definitions of a relation, a function, and the domain and range of a relation. Viewers then learn how to use mappings and vertical...
Curated OER
Terrestrial Ecosystem Response to Climate Change
An extensive investigation of the Earth's climate changes awaits your environmental science classes. This top-notch presentation begins by looking at the history of Earth's climate and then predicts the impact on each major terrestrial...
Curated OER
1914-1918: The World at War
Thorough and engaging, this presentation details the causes and contexts of World War I on all fronts. It covers "the spark" that began it all, as well as the effect of technology on weaponry and the role of women on the home front and...
Curated OER
"Dead-Zones" and Coastal Eutrophication: Case-Study of Chesapeake Bay
Take an in-depth look at nutrient loading, eutrophication, and hypoxia using data on The Chesapeake Bay as an example. This comprehensive presentation includes detailed graphs, photos, and details about the changes in marine organism...
Curated OER
The Coastal Ocean: Estuaries and Continental Shelves
Amazing high-quality satellite imagery, photos, informational graphs, and detailed diagrams comprise this presentation on the movement of estuaries and the continental shelf. Data used as an example is from The Chesapeake Bay and because...
Curated OER
The Geography of Africa
Hop a flight to Africa in this presentation, which includes brilliant and appealing photographs of the continent as well as maps and graphs about its geography, topography, and climate. Those who are researching Africa for a project or...
Curated OER
Why Do We Need Exercise?
Discuss the importance of exercise with your middle schoolers using this PowerPoint. Actively engage them by surveying how they spend their free time and explain many benefits of physical activity. Learners consider what they did over...
Curated OER
The Biogeochemical Cycles
The majority of this presentation is a collection of diagrams and graphs that back your lecture on biogeochemical cycles. The last few slides define ecosystems and the Gaia hypothesis. You may find these slides valuable, but will...
Curated OER
Grids
This fun presentation includes instructions for a grid game, where the child must follow directions to uncover the hidden treasure. They make Mr. Smiley move up, down, right, and left on the grid until he's reached the...
Curated OER
Problem Solving and Puzzles: 3
Your class can use this to warm up or to discuss their problem solving strategies. They review the 8's times tables, relate the multiplication problems to division, then use a chart to solve a word problem involving money.
Curated OER
Finding X and Y Intercepts
How can you solve systems of linear equations? This slideshow introduces learners to the substitution method, the elimination method using addition and subtraction, and the elimination method using multiplication. Guided practice...
Sophia Learning
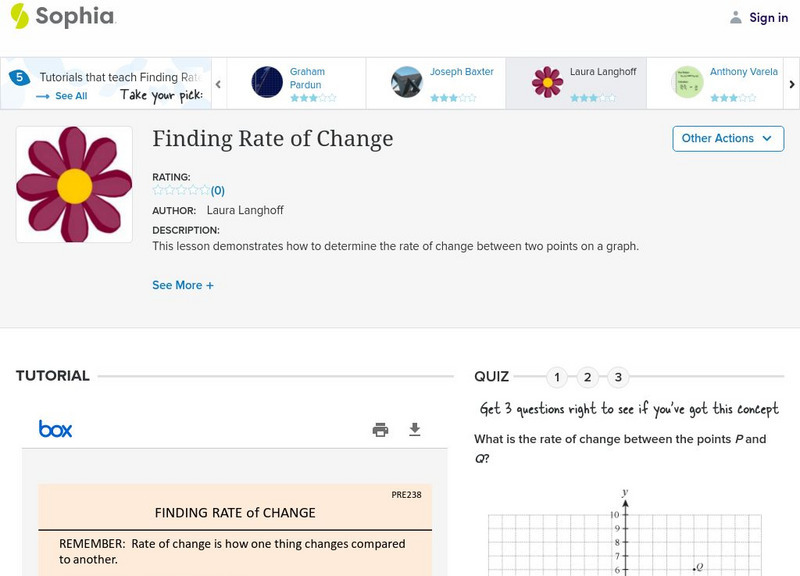
Sophia: Finding Rate of Change: Lesson 3
This lesson demonstrates how to determine the rate of change between two points on a graph. It is 3 of 5 in the series titled "Finding Rate of Change."


